A Geo Boundary is a type of context calculation that is used to create a custom column which divides the visual into two members:
- "in" - the geo-locations within the Geo Boundary.
- "out" - the geo-locations outside of the Geo Boundary.
This provides the option of splitting maps into different sections, which can then be used to drive which part of the map is displayed at any given time.
Note: This feature is not supported for OLAP, Tabular, or SAP BW data sources.
Creating a Geo Boundary
It is a simple and largely automatic process to create a Geo Boundary. In this example, we will create a Geo Boundary that identifies those data points that are inside of Europe and those that are outside of Europe so that we can use a filter to focus on Europe (in) and the Rest of the world (out).
Before you begin
You need to open a Map that contains the data points that you want to include in and exclude from your Geo Boundary. You can create a Geo Boundary on a Bubble Map or a Shape Map. For more information, see Geo Boundary Limitations.
Step 1: Create the Geo Boundary
From the Toolbox:
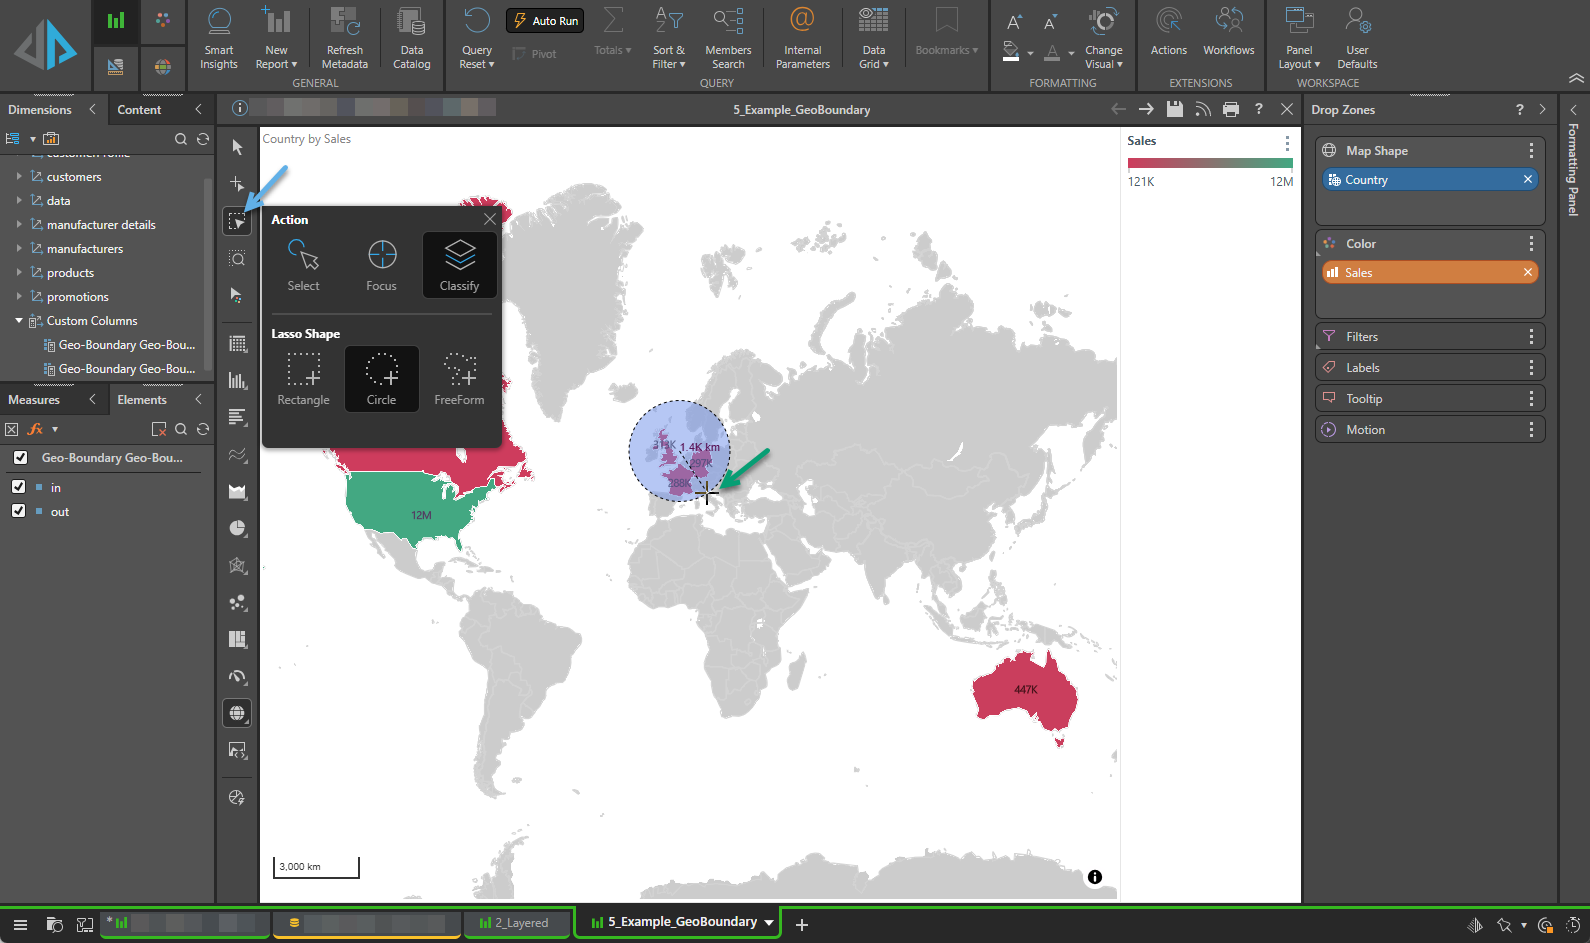
- Right-click the Select Lasso option (blue arrow below) and select the following from the options:
- Action: Classify - This option indicates that you are creating a custom column.
- Shape: Circle - This option indicates that you will select your data points using a circular selector.
- Click on the map in the middle of the countries you want to select and, without releasing your mouse button, drag your cursor outwards (green arrow).
- When you have reached the furthest data point that you want to select, release the mouse key.
You do not need to make these selections if you chose them the last time you used this lasso type. In that case, you can simply click the option in the Toolbox.
A circle is drawn as you drag your cursor outwards from its center. The selected countries are those that are inside the circle once it is drawn.
The Geo Boundary is created and added to the Dimensions panel with a name including the prefix "Geo-Boundary..." The chip is also added to Color drop zone by default, classifying the countries inside of the circle you drew as "in" and countries outside of the circle you drew "out."
Step 2: Managing your Geo Boundary
The Geo Boundary custom column is created and added to the Dimensions panel under the Custom Columns dimension (see purple highlight below). You can right-click this chip to make the following changes:
- Open the Geo Boundary's Elements Tree (blue arrow below) using the View Elements option on the right-click.
- Add the chip to the different drop zones using the Add To options. For a Geo Boundary, these options are Map Shape, Color, Filters, Labels, Tooltip, and Motion.
- Edit the new calculation's Properties.
- Delete the Geo Boundary. This option is only enabled where the Geo Boundary chip is not used on the Map.
The Geo Boundary chip is automatically added to the Color drop zone (orange arrow). This results in the map shapes being colored according to whether they are "in" or "out" of the Geo Boundary. It also adds a Legend to the canvas (blue box). If you drag or Move the chip to the Filters drop zone instead, a slicer is created with options "in" and "out"; select "in" from the slicer to focus on Europe and "out" to focus on the other regions outside of Europe.

Geo Boundary Limitations
The creation of geo boundaries is constrained by the following limitations:
- Map Type: You can only create a Geo Boundary on a Shape Map or a Bubble Map.
- One-off: Geo Boundaries are a one-off custom column that is local to your map. You cannot, therefore, share them across different visuals and the options Make Shareable and Open in Formulate are not offered on the Dimensions right-click menu under Custom Columns.